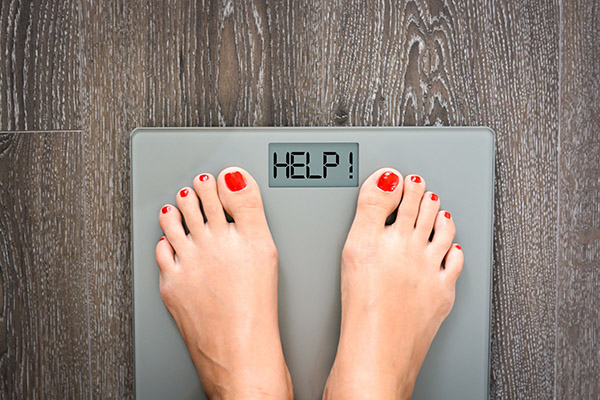
You ever notice how everyone kind of thinks they know whether their weight is “about right” for their height—but when you actually look at the numbers, it’s not so simple? I’ve seen this a lot when people glance at a scale and shrug, without considering where they fall on a standardized chart. And honestly, that chart isn’t just some arbitrary grid—it’s a tool rooted in decades of research from places like the Centers for Disease Control and Prevention and the National Institutes of Health.
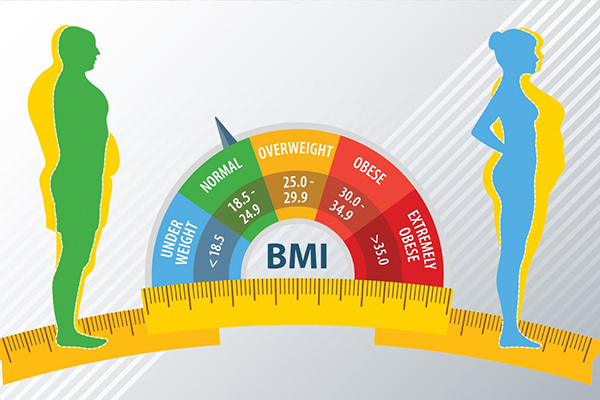
Now, here’s the interesting part: those benchmarks aren’t about squeezing everyone into the same mold. They account for age brackets, gender differences, and body composition. A “healthy weight for adults” has less to do with a single number on the scale and more with how your height and weight align. Because if you fall below that range, risks like nutrient deficiencies and bone weakness climb fast. Go too far above, and you’re looking at higher odds of obesity-related conditions—heart disease, diabetes, you name it.
What I’ve found is that having a clear picture of where you stand—using a height vs weight chart or even your BMI as a starting point—gives you context. It’s not about judgment, it’s about awareness. And once you see where you land, you can make smarter choices.
So, let’s break it down together—how these charts work, what the “normal” adult weight ranges actually mean, and why knowing your number matters more than you might think.
U.S. Height and Weight Chart for Men
I’ll be honest, when I first looked at these charts years ago, I thought they were way too rigid—like, how can a single table capture all the nuances of body type, frame size, and fitness? But here’s the thing: they’re not meant to dictate your life. They’re benchmarks, a place to start. And if you’re like most guys I’ve worked with, sometimes you just need that clear visual to know whether you’re drifting off track.
Below is a straightforward height vs. weight chart for adult men based on U.S. wellness standards. It shows the generally accepted “healthy weight” ranges in pounds for different heights in feet and inches.
| Height (ft/in) | Healthy Weight Range (lbs) |
|---|---|
| 5’4” | 122 – 150 |
| 5’6” | 128 – 156 |
| 5’8” | 134 – 164 |
| 5’10” | 139 – 174 |
| 6’0” | 144 – 184 |
| 6’2” | 150 – 194 |
| 6’4” | 156 – 204 |
Now, keep in mind, these numbers reflect averages and public health guidelines—they don’t know if you’re a marathon runner, a weightlifter, or someone carrying more muscle than most. What I’ve found is the chart works best as a wellness checkpoint, not a verdict. Use it like a compass, then factor in your body composition and personal fitness goals before making adjustments.
U.S. Height and Weight Chart for Women
I’ve noticed something interesting over the years—women often compare their weight to men’s charts, which doesn’t really tell the full story. Female physiology runs on a different set of rules. Estrogen, fertility cycles, and bone density all shift the numbers, meaning the “ideal weight” range for women is usually a bit lower than the men’s column, even at the same height. And honestly, that’s not about being smaller—it’s about how lean body mass and fat distribution work differently.
Here’s a clear height vs. weight chart for adult women based on U.S. health guidelines.
| Height (ft/in) | Healthy Weight Range (lbs) |
|---|---|
| 5’2” | 104 – 135 |
| 5’4” | 110 – 140 |
| 5’6” | 115 – 150 |
| 5’8” | 120 – 160 |
| 5’10” | 125 – 170 |
| 6’0” | 130 – 180 |
Now, here’s the kicker: the average U.S. woman today weighs about 170 lbs, which puts many right at the top of this table even at 5’10”. That’s not me saying “too heavy” or “too light”—it’s just the math. What I’ve found is this chart works best as a wellness snapshot, not a definition of beauty. Use it to see where you stand, but then layer in context: your activity level, your health goals, even how strong you feel day to day. Because numbers only tell part of the story.

Healthy Weight Ranges by Age
You see, one of the biggest mistakes I made in my 20s was assuming the number on the scale should stay the same forever. Back then, metabolism was on my side—I could eat late-night pizza and not notice much the next morning. But by the time I hit my 30s, things shifted. Muscle mass started dropping (quietly at first), and my body didn’t burn calories with the same fire it used to. That’s when I realized: “ideal weight” isn’t a fixed point, it moves with age.
Here’s the thing—public health data, like the CDC weight stats, show clear trends. In your 20s, staying at the leaner end of the healthy BMI range makes sense because you’ve usually got higher activity levels. By your 40s and 50s, hormonal changes and lifestyle factors often nudge the “comfortable” range upward by a few pounds. And in your 60s or beyond, the recommendations loosen a bit more—not because extra weight is “better,” but because slightly higher reserves can actually protect against illness and frailty.
What I’ve found is the smartest approach is adjusting expectations decade by decade. Instead of chasing your 25-year-old self, ask: what’s the healthiest weight for my body at this stage of life? That shift in perspective alone takes a lot of pressure off.
Differences in Frame Size and Muscle Mass
I can’t tell you how many times I’ve seen someone panic because they’re “10 pounds over” a chart, when really their frame size or muscle mass explains it all. Charts give ranges, but your bone structure and lean tissue shift the numbers. For example, the old trick of measuring wrist circumference? It actually does a decent job at predicting frame size—something I thought was a gimmick until I tried it myself.
Here’s what I’ve found helps people make sense of it:
- Small frame (ectomorph-leaning) → Typically lighter bones, narrower joints, and lower natural muscle mass. Healthy weight tends to sit on the lower side of the range.
- Medium frame (mesomorph tendencies) → Falls right in the middle. Usually able to build muscle more easily, so the “average” recommendation actually makes sense here.
- Large frame (endomorph build or dense bone structure) → Can carry more weight without it being “excess fat.” A person like this may look heavier on paper, but in reality, they’re just structurally bigger.
- Athletic or muscular bodies → Muscle weighs more than fat (per volume), so an athlete can be 20 lbs above “ideal” and still have a lower body fat percentage. I’ve seen lifters technically land in the “overweight” BMI category while being in the best shape of their lives.
Now, the takeaway? Don’t treat the chart like gospel. Use it as a reference, but filter it through your body type and lifestyle. That’s the balance most people miss when they just chase a number.
Health Risks Outside Ideal Range
I’ll be straight with you—every time I ignored my own numbers, thinking “eh, a few pounds won’t matter,” I ended up feeling the effects in ways I didn’t expect. And it’s not just about looks. U.S. health data makes it clear: drifting too far below or above your ideal weight range can set off a chain of risks you don’t want to deal with later.
Here’s what I’ve seen (and sometimes learned the hard way):
- Being underweight → It’s not harmless. Low body fat can mean nutrient deficiencies, fragile bones (osteoporosis risk creeps up fast), and in women, disrupted cycles linked to fertility issues.
- Being overweight → Now, this is where the big public health concerns sit: type 2 diabetes, hypertension, and cardiovascular disease. Extra weight doesn’t just “sit” there; it fuels insulin resistance and chronic inflammation.
- Carrying obesity long-term → The risks multiply—higher chances of stroke, some cancers, even reduced life expectancy. And I think the scary part is how quietly it happens. You don’t always feel the damage building.
What I’ve found is that weight outside the “healthy zone” isn’t just about vanity—it’s about lowering future risk factors. Catching it early, before numbers turn into conditions, is the real game changer.
How to Use This Chart Effectively
I’ll admit it—I used to glance at charts, shrug, and move on. But the truth is, they’re way more useful when you treat them like a tool instead of a trivia fact. The key is consistency and knowing what to measure, not just eyeballing where you think you land.
Here’s a step-by-step that’s worked well for me (and the people I’ve coached):
- Measure your height accurately → Don’t guess. Stand barefoot, back straight against a wall. I like using a hardcover book on top of my head—it’s low-tech but surprisingly precise.
- Weigh yourself under consistent conditions → First thing in the morning, after the bathroom, before food. If you weigh at random times, the numbers bounce around and it feels discouraging.
- Plot it against the chart → Find your height in inches or feet/inches, then match it to the weight range. I think of it less like a “pass/fail” and more like a compass pointing me toward balance.
- Track over time → This is the part most people skip. Use a notebook, or if you’re like me, just log it into a health app on your phone. Seeing the trend line tells a much clearer story than one random weigh-in.
- Layer in context → If you’re building muscle, don’t panic if you’re “above range.” Same if you’re naturally petite—healthy doesn’t mean forcing your body into the middle of a chart.
Related post: Does PediaSure Help You Grow Taller?

Hello, my name is Mike Nikko and I am the Admin of Deliventura. Gaming has been a part of my life for more than 15 years, and during that time I have turned my passion into a place where I can share stories, reviews, and experiences with fellow players. See more about Mike Nikko